Twitter Analytics: How to Use & Analyze it to improve Marketing
Social media management doesn’t stop at posting content. The real deal starts after that. “WATCH. ANALYZE. IMPROVE.” Whether it is Twitter or any other social media platform, you are bound to see how your content is performing and how you can improve your social presence. There are a lot of tools available for free from the social networks themselves – Facebook insights, Instagram insights, Pinterest analytics, and now Twitter analytics too.
Twitter analytics was first launched in 2014. Since then, continuous updates have been made by Twitter to improve this tool. Twitter analytics have indeed marked a solid move towards transparency and measuring abilities for all tweeters. Still, most people are not completely aware of the information it can provide. Especially, when you are using Twitter for business, it can provide you with loads of data to ace your Twitter marketing strategy.
Now, the obvious questions that arise in your minds are:
“How to navigate to Twitter analytics?”
“How to use Twitter analytics?”
“What data can Twitter analytics provide?”
“How that data can be utilized to improve presence on Twitter?”
In this article, you will get all your answers related to the use of Twitter analytics for your business.
What is Twitter analytics?
“Twitter’s analytics help you understand how the content you share on Twitter grows your business.” – Twitter
So basically, Twitter analytics will combine the behavior of your audience and all the actions that they take when they come across your post or profile. It calculates all the Twitter impressions, likes, clicks, retweets, follows, and a lot more. All this data will assist you in tracking your Twitter activity, analyzing your performance, and ultimately refining your strategy.
You will be able to see how your account is performing overall. Even if you log in daily and check the likes and replies that you receive, it is necessary to see all the Twitter insights together to make informed decisions.
How to access your Twitter Analytics?
Step 1: Log in to your Twitter account
Log in to the Twitter account that you want to analyze. On the left-hand side, there is a panel. From the options available in the panel, click on the “More” button.

Step 2: Go to Analytics
After clicking on the more button, a pop-up menu will appear. From it, select the option of “Analytics.”

Step 3: Start consuming all the data!
The Twitter analytics’ interface is quite simple and easy to understand. You will see the number of tweets made in the past month, impressions received, profile visits, followers gained/lost, top tweets, top followers, Twitter mentions, and much more.
Which Metrics are important in Twitter Analytics?

1. Top Tweet
This will show you the top tweet of the month that gained the maximum impressions. Look at this one closely! Because it is a good example of what you are doing right. What different did you write? What was the tone of the message? Was it positive or critical? Which hashtags id you use? Since it reached the largest audience, try to create more tweets on similar grounds to hook your audience to your profile.
2. Followers gained/lost
This will show you the number of followers gained or lost in a particular month. If it is rising, it is a good sign. It means that people like what you are sharing and want to see more of it in the future. If it is decreasing, try to change the kinds of tweets that you make to attract people and make them follow you.
3. Top follower
It will show you the top follower of the month having the highest followers on his/her own. It doesn’t necessarily mean that the person has shared your content the most. But, it does mean that they have the largest potential audience. Thus, it would be great if you can follow him/her back, as they hold the greatest potential to increase the exposure of your tweets through retweeting or commenting.
4. Top mention
This metric of Twitter analytics will show you the tweet with the highest impressions in which you were tagged by another user. Now, you’d want to check whether that tweet is a positive or negative one. In case it’s positive, make sure to thank that person and be in touch for future collaboration opportunities. When it’s negative, reach out to the person directly or in the comment section to find out a solution and fix your relationship with that user/customer. If you are a business, you definitely need to monitor this every now and then.
5. Engagement
Engagement will show you the number of times a user interacted with your tweet. It will take count of all the likes, retweets, mentions, replies, and follows received from a particular tweet. If you are not getting good and consistent engagement, it means that you are lacking quality in your content. Keep a track of engagement levels received on different tweets to find out what’s working for you.
6. Engagement rate
The engagement rate is calculated by dividing the number of engagements by the number of impressions that a tweet receives. A higher engagement rate is a clear sign that the people who saw your tweet actually interacted with it. On the other side, a lower rate shows that people came across your content, but did not find it interesting enough to react to it.
7. Link clicks
This Twitter insight shows you the number of times a user clicked on a link from your tweet. They are also used in the calculation of engagement rate. Still, seeing them separately lets you know whether people are interested in the link you share or not. If it is the link to your products or services, you can calculate the number of people who might be interested in your products.

8. Cost Per Result (CPR) – Twitter ad metric
This metric will be visible in Twitter analytics when you run ads. CPR is an average of how much you pay for each action that people take after seeing your ad. Keeping a track on CPR will help you in managing the budget of your ad campaigns.
9. Conversions – Twitter ad metric
When you run Twitter ads, conversions are the most important metric to keep track of. It will let you know what actions people are taking after coming across your ad. You will see whether the main objective of running an ad is fulfilled or not.
How to Use Twitter Analytics
Now let’s see how you can put all those glittery numbers to actual use and create better content, reach new audiences, and improve user experience.
1. Get educated about your audience

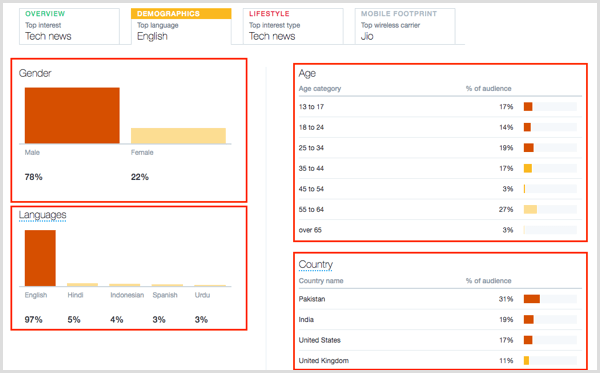
If you want to grow organically and make your brand reach to the right people, you have to know your audience first. In order to craft out the perfect tweets, you need to understand what your audience is interested to see. Learning about their age, gender, interests, and demographics will help you in curating relevant content. All this information is available under the “Audience Insights” section.
2. Curate content that your audience likes
Know what your audience is really into – Images, GIFs, videos, memes, informational links, or anything else. Experiment with your content and see what gains the maximum engagement. Keep an eye on the Twitter trending topics and try to be a part of the trends relevant to your industry. Closely monitor your engagement metrics and you can learn what precisely connects with your target audience.
3. Run precisely targeted ads
While running Twitter ads, the most important part is to select the target audience and to choose the right tweet to promote. Promoting the top tweet of the month might be a good idea to reach the maximum people. Twitter analytics can show you how your paid ads perform as compared to your organic tweets. Thus, you can see how much your invested money is expanding your reach. You can also compare the effectiveness of different ad campaigns to run more precise ads in the future.
4. Find out best times to post
The best time to post on social media is when your audience is the most active and most likely to engage with your content. With Twitter, it is very important to post at the best time, because the average lifespan of a tweet is only 18 minutes. Thus, if you post at hours when your audience is not active, your tweet might get lost in the pool of other tweets.
In Twitter Analytics, you can see the breakdown of your audience according to their country. You will also see the device they are using the most to operate Twitter. For example, if most of your audience is using it on a desktop, they are more likely to remain online during office hours. Also, check the tweets with the most engagement. At what time they were posted? What were the days? Try to post as much as possible according to that data.
Free Twitter Analytics tools
In case you wish to dive even deeper into the content properties, you can give a shot to third-party Twitter analytics tools. Here are some tools that will help you in finding the right hashtags, keywords, influencer analytics, campaign analytics, track mentions, and learn about your audience.
- TweetReach – User, Keyword and Hashtag Analytics
- Klear – Influencer analytics
- Tweet Binder – Campaign analytics
- Mention Map – User, Mention, and Hashtag Analytics
- Social Rank – Follower analysis
- Tweepsmap – Competitor analysis
Start exploring! Start improving!
It’s indeed amazing that Twitter has given such detailed analytics to its users on the engagement and statistics behind the tweets that they make. Using them, you can build an informed Twitter marketing strategy and boost your following.
Event, audience, and top tweet data can offer ideas for click- and-share worthy content. It’s free, easy to use, and lets you export all the analytics data as a CSV file. So go to your dashboard now and start studying the important metrics!
Also, if you want to increase engagement on your Twitter profile and gain real followers, we recommend you to checkout TweetFull. It is a Twitter automation tool that will increase your engagement levels and conversions by auto-liking, auto-retweeting, and auto-following your target audience. Know more.


